



- THE PENSION SYSTEM: A MODEL FOR RUSSIA AND INTERNATIONAL EXPERIENCE
- Modeling the Pension System of the Russian Federation
- 8. The Demographic Forecast
- Modeling the Pension System of the Russian Federation
8. The Demographic Forecast
Demographic indicators are perhaps the most significant pension system parameters. It is the demographic crisis provoked by the increasing longevity and falling birth rates that made pension reform one of the most pressing concerns in many countries. There has been a sharp increase in the share of the aged in total population. Russia is also facing these problems, although unlike most other countries, aging here is occurring due to the falling birth rates unaccompanied by increased longevity (which is even diminishing).
In the paper[1], we examined the RF Goskomstat forecast of the country’s total population basing ourselves on Goskomstat’s report “On Russia’s demographic development trends in the first half of the 21st century”[2], which, although not an official document, nevertheless provides an idea of the RF Goskmostat’s opinion on this issue.
The report considers three demographic development scenarios, low, middle, and high, under which the expected population size varies within a wide range: the difference between the population sizes in the consequential scenarios is 24 – 25 million persons.
Goskomstat’s procedure for the drafting of demographic forecasts, under which the combination of low birth rate and low longevity amounts to the low forecast, the combination of middle figures, to the middle forecast (which we shall heretofore designate as basic), and the combination of high figures, to the high forecast, was most probably determined largely by the goal facing this organization, namely, to estimate the extent of the variation of the country’s total population under different assumptions.
However, in terms of the pension system, population size per se is immaterial. For the PAYGO pension system, the main indicator is the number of pensioners/number of the employed ratio, which shows which part of one pensioner’s pension is funded by one employed person[3]. Since the number of the employed (contribution payers) and pensioners is determined by many factors (including legislative ones), which may change in future, the pension business often uses a purely demographic indicator, the old age dependency ratio, determined as the ratio of persons of retirement age to the number of persons of employable age[4].
Analysis of the RF Goskomstat demographic forecast shows that between 2002 and 2050, the pensioner dependency ratio can be expected to rise from 0.33 to 0.7 – 0.8 (depending on the forecast), which means that in 50 years’ time, the problems of public pension provision will become much more serious. It is noteworthy that the old age dependency ratio changes insignificantly depending on the forecast[5]. This can probably be explained by the fact that the RF Goskomstat brings together in the same scenarios factors that have an opposite effect on the pensioner dependency ratio. A high birth rate is a factor, which reduces this ratio by raising the share of persons of employable age, while higher longevity increases it by increasing the number of retirement age persons.
Of course, in theory, there are grounds for combining mortality and birth rates in one demographic scenario, but, obviously, this is not the only possible combination. A probable scenario is a combination of low birth rates with high longevity[6] or a high birth rate with low longevity. These versions result in a much broader variation of the predicted pensioner dependency ratio values.
It is important that even the high longevity forecast can be designated as such only in comparison with present-day longevity in Russia or with the other forecasts. If we compare predicted longevity in 2050 (70 years for men and 81 years for women) with current longevity in the advanced countries, we shall see that in Great Britain, for instance, it is already 75 years for men and 80 years for women. In the mid-21st century, expected longevity in that country will be about 80 years for men and 85 years for women[7]. Thus, even the high Goskomstat forecast implies that in 2050, male longevity in Russia will be lower than it now is in many countries, and that female longevity will reach the current value. This assumption is conservative in terms of population forecasts but not in terms of pension system issues, since the scenario envisaging much higher longevity (especially for men) is also quite feasible.
In view of the above, the authors included one more, “extra-high” scenario, which provides for raising average longevity to 74.5 years for men and 84.5 years for women, and a rise of the total fertility rate to 2.15, that is, the population reproduction rate[8].
RF Goskomstat’s low scenario envisages a very low birth rate and longevity. Should the low birth rate scenario be enacted, Russia’s present-day population would rapidly disappear. But even if this happens, it cannot mean that 1/7th of dry land will become uninhabited: a void is always filled. In this case, immigration into Russia will probably be much higher than that envisaged by Goskomstat’s forecast. As for low longevity, cynical though this may sound, it would only benefit the pension system. In view of the above, the authors consider it worthless to concentrate on the low birth rate and longevity scenarios.
We have already said that our basic scenario is RF Goskomstat’s middle one (below, all the middle scenario parameters are referred to as basic). This decision is largely determined by it being accepted as such by the ministries and administrative departments concerned, and is used as the foundation for the macroeconomic forecast of the RF Ministry for Economic Development and Trade. The supplementary scenarios include:
· a high scenario; and
· an extra-high scenario;
as well as combined scenarios:
· basic (middle) fertility and extra-high longevity; and
· extra-high fertility and basic (middle) longevity.
The latter two scenarios are important if we want to estimate the range of the possible variation of the old age dependency ratio.
Fig. 20 shows the population forecast for the above scenarios, and Fig. 21 – the old age dependency ratio for the legislatively established retirement age, 60 years for men and 55 years for women. Fig. 21 makes it clear that the combination of an extra-high birth rate with extra-high longevity would result in an old age dependency ratio that is very close to the figures in the basic and high demographic scenarios. Only the mixed versions combining basic and extra-high figures would entail significant distinctions in the old age dependency ratios. This is a matter of principle for further modeling, helping to select the really important scenarios: in future, we shall use mostly the basic scenario and the mixed scenarios combining basic and extra-high indicators.
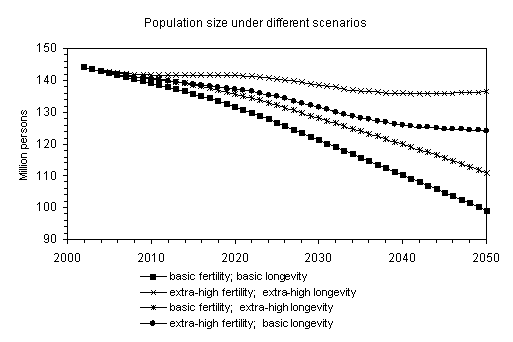
Fig. 20
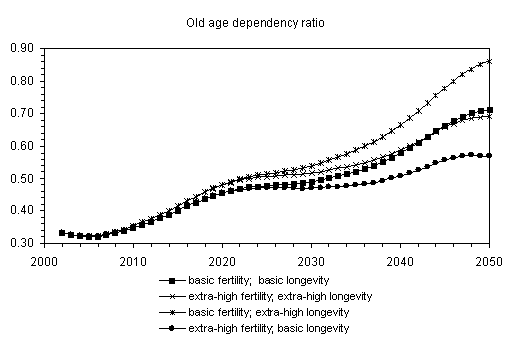
Fig. 21
The effect of retirement age on the old age dependency ratio is illustrated in Fig. 22, which demonstrates these ratios calculated for raised retirement age as percentage of the ratios obtained for the current retirement age under three different demographic forecasts. Rising retirement age for women to 60 (see the three upper curves, which match different demographic forecasts) would result in an average relative reduction of the old age dependency ratio by 20%, and if retirement age were raised to 65 for men and women, this figure would be, on average, 45%. The effect of the demographic forecast on the examined parameter is insignificant, and its variation in relation to the average value can probably be explained by the demographic waves in the age and gender structure of Russia’s population.
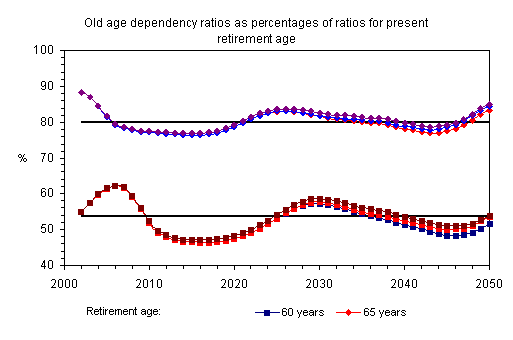
Fig. 22
Residual longevity
While in terms of the PAYGO pension system the main demographic indicator is the old age dependency ratio, for the funded system this is longevity or, to be more precise, residual longevity upon reaching retirement age.
Fig. 23 shows longevity at birth, where the bottom group of curves pertains to men, and the upper, to women. Each group contains four curves valid for different scenarios (top to bottom): extra-high, high, basic, and low. Fig. 24 illustrates the dependency of residual longevity among men and women upon their age (including retirement age) for the threshold forecasting years, 2002 and 2050. Analysis of these charts shows that:
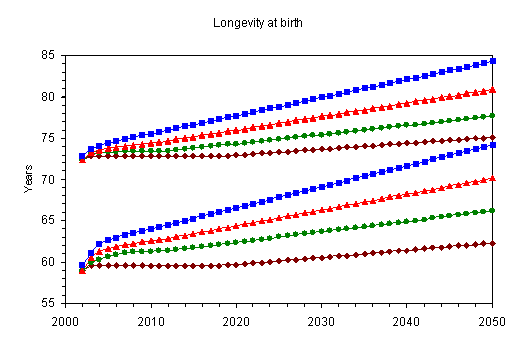
Fig. 23
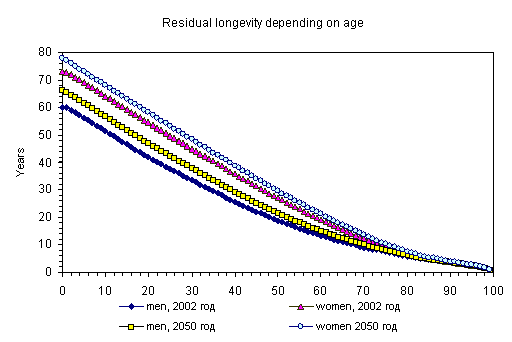
Fig. 24
1) Residual longevity among women is much higher than among men. Depending on the demographic forecast and year, the difference reaches 6.5 - 7.5 years for 55-year-old men and women, 5.5 - 6.5years for the 60-year-olds, and 4 - 5 years for 65-year-olds.
2) If retirement ages for men and for women remain different, this distinction is even greater. In 2002 (the first year of reform), residual longevity among 55-year-old women was 23 years, and among men, 13.5 years, the difference reaching almost 10 years!
3) In 2002, average weighted (from the number of 55-year-old women and 60-year-old men respectively) residual longevity was approximately 19 years; and this is, the figure indicated in the Law on Labor Pensions in the Russian Federation. In future, residual longevity will rise (see table). This is why the residual longevity “prescribed” by the law will require a revision.
|
|
2002 |
Projected residual longevity for 2050, years | |||
|
|
|
Low |
Basic |
High |
Extra-high |
|
Men |
13.5 |
14.0 |
15.3 |
17.0 |
19.0 |
|
Women |
23.0 |
23.8 |
25.3 |
27.6 |
30.0 |
|
Average |
18.9 |
19.5 |
21.0 |
23.0 |
25.2 |
|
Average longevity increase |
|
3.5% |
11% |
22% |
34% |
4) Under the RF Law on Labor Pensions, when the NDC element of labor old-age pension is assigned at an age which exceeds retirement age (i.e., over 60 years for men and over 55 years for women), the expected duration of the payment of labor old-age pension used to calculate NDC pension is reduced by one year for each full year that has elapsed since reaching retirement age. As is to be expected, real residual longevity diminishes at a slower pace. Residual longevity among 65-year-old men is lower than residual longevity among 60-year-old men not by five years but by 2.6 - 2.7 years, and residual longevity among 60-year-old women is lower than that among 55-year-old women by 3.8-4.1 years[9]. The legislatively established decrease of the expected payment period is really a stimulus for delaying the outset of the receipt of NDC pension.
5) Residual longevity is usually borrowed from the mortality table for the given year, e.g., 2010. As regards the group who retired at the age of 60 in 2010, real mortality is, however, different:
· at the age of 60, mortality should be borrowed from the mortality table for 2010;
· this cohort will turn 61 in 2011; this is why the probability of the death of 61-year-old persons should be borrowed from the mortality table for 2011; 62-year-old persons, from the 2012 table, etc.
Since it is assumed that for each following forecasting year, mortality will be lower than for the previous one, real mortality rates will be lower than the ones borrowed from the 2010 table, and actual residual longevity will be higher than that calculated based on the 2010 table.
Analysis of the possible distortion of residual longevity arising because it is calculated using the mortality table for the year of retirement (that is, without account of future mortality decrease) shows that for the basic scenario, it lies within 2%, for the high scenario, 4%, and for the extra-high scenario, 7%. Such distortions are immaterial in long-term forecasting, although they may have some significance for organizations, which sell annuities (e.g., insurance company).[1] Baskakov, V.N., Lelchuk, A.L., and Pomazkin, D.V., RF Pension System Model, Sotsialnyi vestnik, 2002, No. 3, pp. 3 – 35.
[2] Voprosy statistiki, 2002, No. 3, pp. 3 – 10., 2002, No. 3, pp. 3 – 10.
[3] The inverse value is equal to the number of employed persons who fund the pension of one pensioner out of their taxes.
[4] Under the current pension system, retirement age persons include the women over 55 and the men over 60, and employable age persons, the women aged 15 – 54 and the men aged 15 – 59.
[5] This means that the demographic forecasts under which the country’s population differs by more than 20 million persons are equivalent in terms of a PAYGO pension system.
[6] This version does not contradict empirical data; in Italy, for instance, high longevity is accompanied by a low birth rate.
[7] National population projections 1998-based. Series PP2 no.22. Government Actuary’s Department of Great Britain, www.gad.gov.uk.
[8] Since this paper does not examine the effect of migration, the middle migration scenario is used.
[9] It is obvious that the lower the mortality rate, the faster residual longevity diminishes.
