



- THE PENSION SYSTEM: A MODEL FOR RUSSIA AND INTERNATIONAL EXPERIENCE
- Modeling the Pension System of the Russian Federation
- 5. Age/Gender Population Structure: A Forecast
- Modeling the Pension System of the Russian Federation
5. Age/Gender Population Structure: A Forecast
5. Age/Gender Population Structure: A Forecast
Demographic indicators are probably the most important pension system parameters. It is the demographic crisis caused by higher longevity and a sharp drop of birth rate that has made pension reform one of the most pressing concerns in many countries. The share of the aged in total population is rising. Russia also has to cope with this problem, although unlike most other countries, the aging takes place through a fall in fertility alone, in the absence of higher longevity.
The dynamic of the age and gender structure of the population is shaped by three factors, birth rate, mortality, and migration.
In the second half of the 20th century, total fertility rates in many countries fell below the level that ensures reproduction (approximately 2.1 children per one woman). This also happened in Russia, where fertility fell in the 1990s.
Table 1
Total fertility rate[1]
|
Country |
1960 |
1970 |
1980 |
1990 |
2000 |
|
Great Britain |
2.72 |
2.43 |
1.90 |
1.83 |
1.65 |
|
France |
2.73 |
2.47 |
1.95 |
1.78 |
1.89 |
|
Germany |
2.37 |
2.03 |
1.56 |
1.45 |
1.36 |
|
Italy |
2.41 |
2.42 |
1.64 |
1.34 |
1.23 |
|
Russia |
2.42 |
1.97 |
1.89 |
1.89 |
1.21 |
In 1999, total fertility rate in Russia reached its lowest value, 1.17; in 2000 and 2001, it began to rise insignificantly.
Below, we offer a brief analysis of the RF State Statistical Committee’s forecast of Russia’s population based on report “On demographic development trends in Russia in the first half of the 21st century”[2], which, although not an official document, conveys the view of the Committee on this issue.
The report examines three fertility scenarios:
1. Low, with the total fertility rate falling to the minimal European one, 1.09.
2. Middle, with the total fertility rate rising to 1.4.
3. High, with the total fertility rate rising to 1.75.
Another demographic forecast parameter is the mother’s average age at the birth of a child. The low scenario assumes that it stabilizes at a slightly lower than the present age, 25.7 years, while the middle and high scenarios envisage its rise to 27.8 and 30.6 years.
Figs 9 and 10 show two integral mortality indices, expected longevity at birth and the death rate in employable age. They make it quite clear that unlike the advanced countries, longevity in Russia did not increase over the past forty years. What is more, in 1994, mortality reached the maximum level in more than forty years, and the reverse trend, which manifested itself in the next few years, was again replaced by new growth in 1999 and 2000.
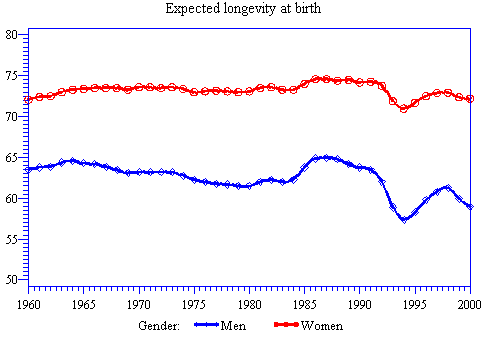
Fig. 9
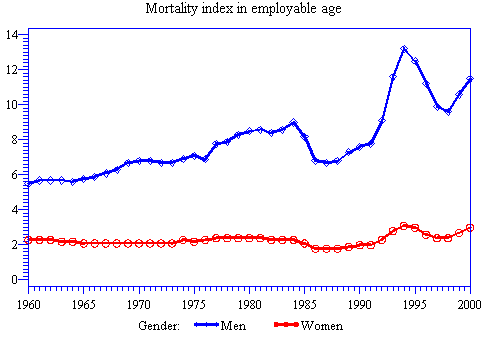
Fig. 10
The report scrutinizes three mortality scenarios:
1. Low, under which male longevity is expected to reach 62.4 years, and female longevity, 75.2 years, which means, in fact, that before 2050, longevity in Russia will not exceed the 1986 figures.
2. Middle, under which these figures will be 66.3 and 77.7 years respectively.
3. High, which expects male longevity to rise to 70.3 years, and female longevity, to 81.0. Even if this happens, longevity in Russia in 2050 will still be lower than it currently is in some advanced countries.
All scenarios provide for a significant decrease of infant mortality rate, from 15.3 deaths for 1000 infants to 5.0, 3.8 and 3.5 in the low middle, and high scenarios respectively.
All three scenarios envisage low international migration to Russia. It is expected to fall from 45 000 in 2005 to 30 000 in 2050 in the low scenario, from 96 000 to 61 000 in the middle scenario, and from 127 000 to 90 000 in the high scenario. There is also a fourth (supplementary) scenario, under which net migration will be approximately 270 000 persons a year.
The report presents the outcomes of the population forecast based on the four scenarios (see Table 2).
Table 2
Scenario parameters and expected population size in Russia
|
|
Scenario | |||
|
low |
middle |
middle with high migration |
High | |
|
|
Total fertility rate | |||
|
2000 |
1,2 |
1,2 |
1,2 |
1,2 |
|
2025 |
1,09 |
1,4 |
1,4 |
1,66 |
|
2050 |
1,09 |
1,4 |
1,4 |
1,75 |
|
|
Expected longevity at birth (men), years | |||
|
2000 |
59,0 |
59,0 |
59,0 |
59,0 |
|
2025 |
60,2 |
63,1 |
63,1 |
65,5 |
|
2050 |
62,4 |
66,3 |
66,3 |
70,3 |
|
|
Expected longevity at birth (women), years | |||
|
2000 |
72,2 |
72,2 |
72,2 |
72,2 |
|
2025 |
73,4 |
75,0 |
75,0 |
76,9 |
|
2050 |
75,2 |
77,7 |
77,7 |
81,0 |
|
|
Growth through migration, thousand persons | |||
|
2001-2025 |
1050 |
2204 |
4609 |
3104 |
|
2026-2050 |
790 |
1675 |
6650 |
2470 |
|
|
Permanent population, as of year end, thousand persons | |||
|
2000 |
144819 |
144819 |
144819 |
144819 |
|
2010 |
134685 |
138186 |
138601 |
140116 |
|
2020 |
121983 |
130990 |
131836 |
137323 |
|
2030 |
107311 |
121501 |
123994 |
132758 |
|
2040 |
92129 |
111568 |
115920 |
127036 |
|
2050 |
77162 |
101921 |
107605 |
122634 |
[1] The Demographic Yearbook of Russia. Collection of Statistics, Moscow: Goskomstat, 2002.
Population of the Countries of the World. Reference Book, Ed. By B.Ts. Urlanis, Moscow: Statistics, 1978.
E.M. Andreev, L.E. Darsky, and T.L. Kharkova, A Demographic History of Russia: 1927-1957.
Recent demographic developments in Europe. 2001, Council of Europe. Strasbourg, Council of Europe Publishing, 2001.
INED. Base de données. La conjoncture des pays développés en chiffres.
2001 Statistical Abstract of the United States.
US Census Bureau. International data base.
[2] Voprosy statistiki, 2002, No. 3, pp. 3-10., 2002, No. 3, pp. 3-10.
