



- THE PENSION SYSTEM: A MODEL FOR RUSSIA AND INTERNATIONAL EXPERIENCE
- Modeling the Pension System of the Russian Federation
- 6.4.The economically employed
- Modeling the Pension System of the Russian Federation
6.4.The economically employed
The study of the number and the age and gender structure of the persons employed in the economy (hereafter, the employed) is very important for the purposes of this work because, first of all, most of them are payers of pension contributions. Most, but not all. Some people are released from making payments to the Pension Fund under the law (1), and some evade such payments (2). Unfortunately, there is no reliable statistics on the number of these groups; the share of payers of pension contributions among the employed is usually estimated with the help of expert techniques on the basis of these persons’ age and gender structure[1].
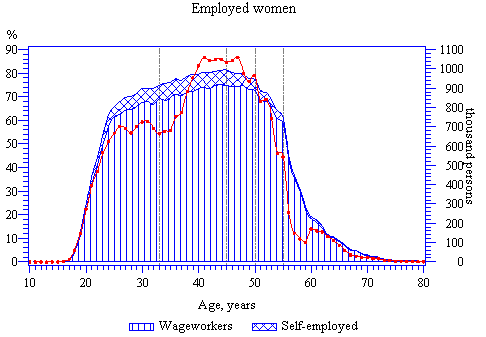
Fig. 16
When examining the age and gender structure of the employed, one must not forget that they are not a homogeneous group in terms of the size of pension contributions they are obliged to make under the law; that is, wageworkers, entrepreneurs, lawyers, etc. all pay different contributions. Also, depending on the category of payers, the collected contributions may go into different financial flow, e.g., the non-pensioners’ contributions are used to increase pension capital (notional or actual), while those of employed pensioners, to raise their pensions. This is why, when analyzing the age and gender structure of the employed, it is also important to identify their main subgroups, including the employed non-pensioners, employed old-age and disability pensioners, and wageworkers and the self-employed.
As illustrations, Figs 16 – 19 present the shares of employed women as percent of the total size of the relevant groups. The charts break down the employed into wageworkers and the self-employed[2] and show the calculation size of the analyzed group.
Analysis of the obtained dependencies reveals the following. The share of employed persons who graduated from secondary school and completed subsequent training (aged 17 – 23) increases in linearly to 80% among men, and to 65% among women. Then the share of employed men remains practically the same, and the share of women continues to rise up to the end of the reproductive age, reaching the male employment rate by the age of 45. After 45, the share of employed persons of both genders begins to gradually diminish due to retirement on the grounds of old age. By retirement old age, the share of the employed is 40 – 50% of total population; after the age of 75 – 80, very few people are employed.
The share of employed men and women who are non-pensioners almost exactly follows the age and gender structure of the employed, the difference being that after the age of 45, too, their share remains stable, 80-85%, up to the onset of retirement age[3]. After that, all the members of the non-pensioner cohort go over to that of pensioners. The share of employed old-age pensioners monotonously decreases from 80 – 90%. The exception is the reproductive age in women (33 – 45 years) and the periods when large numbers of men begin to draw early pensions (33 – 45 years). The employment rate of disabled persons depends very little on age. Starting with 23, it varies within 20 – 25% almost until retirement age. In retirement age, the disabled employment rate is 5 – 10%, monotonously decreasing with time.
Fig. 17
The share of self-employed men among all employed persons is almost doubled that among the women. In employable age, these shares weakly depend on age and are approximately 10% among the men and 5% among the women.
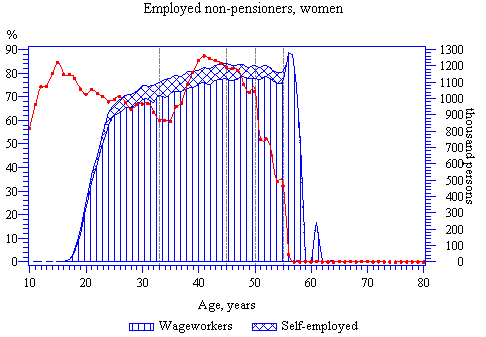
Fig. 18
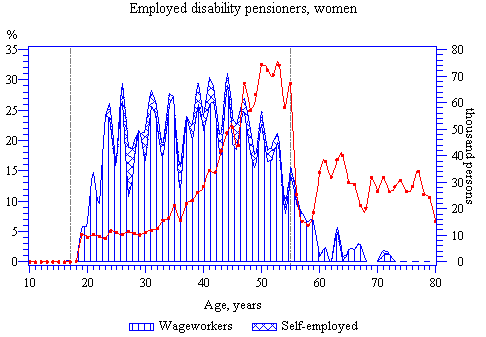
Fig. 19
[1] There may appear, in the future, groups of pension contribution payers who are not employed, e.g., women on maternity leave, active servicemen, unemployed persons, etc.
[2] The self-employed group includes the respondents who gave one of the following answers to the question “Which of the following categories best describe your occupational status?”
· enterprise, company owner or co-owner, etc.;
· entrepreneur without the establishment of juridical person;
· farmer;
· employed on an individual basis;
· member of a production cooperative;
· employed without pay in a family firm or trade.
[3] The distinctions in the shares of all employed persons and the non-pensioners arise from the differences in the calculation base. In the former case, it is the entire population, and in the latter, all non-pensioners.
