



- THE PENSION SYSTEM: A MODEL FOR RUSSIA AND INTERNATIONAL EXPERIENCE
- Modeling the Pension System of the Russian Federation
- 3. The Basic Algorithms of the Model
- Modeling the Pension System of the Russian Federation
3. The Basic Algorithms of the Model
The introduction of NDC and funded elements of labor pension complicated the modeling of the RF pension system, because now we have to factor in the history of the payment of contributions, not just the wage at the date of retirement and the length of service.
In mathematical terms, the calculation of conventional accumulations for the NDC part of the pension is the same as the calculation of real accumulations.
The modeling of the RF pension system uses the method of social cohorts, which we shall explain using the calculation of NDC old-age pension as an example. Calculated on the basis of this method, pension sizes are, in fact, the sizes of the pension of the “averaged man” and the “averaged woman” who in the past were wageworkers, self-employed, unemployed, student, serviceman etc.
Let us note, first of all, that for the purposes of the modeling, each age and gender group is broken down into five subgroups:
1. Recipients of labor old-age pension (hereafter, old-age pensioners). As regards the age and gender groups, which have not reached the retirement age established by Art. 7 of the Federal Law # 173-FZ (55 years for women and 60 years for men), the reference is to early old-age pension in conformity with Arts. 27 and 28 of this law.
2. Recipients of labor disability pension (hereafter, disability pensioners).
3. Recipients of survivor pension.
4. Social pensioners, that is, the recipients of social pension.
5. “Non-pensioners”, that is, the persons who do not draw any pension. For the age and gender groups that have not reached the retirement age set by Art. 7 of the Federal Law # 173-FZ, this subgroup is the principal one (the largest).
The model examines in more detail subgroups 1, 2, and 5 because of their significance (in terms of the size of currency flows connected with them) and the availability of adequate statistics. To be more precise, three social cohorts defined on the basis of this classification are studied.
By social cohort, we imply groups of individuals: “non-pensioners”, “old-age pensioners”, and “disability pensioners” who were X years old in forecasting year Y. The model considers these cohorts as they evolve.
One must be aware that this categorization is not based on employment (or the payment of contributions). Members of the “non-pensioners” cohort need not be employed: they may be students, homemakers, or be idle, while part of old-age and disability pensioners may continue to hold jobs and pay contributions thus raising their pensions.
To understand what happens to these cohorts in time, let us consider the men who were 15 in 2002. It is obvious that the old-age (including early) and disability pensioner cohorts will be empty and that a large “non-pensioners” cohort will exist. As time goes on, in the following forecasting years, the “non-pensioners” cohort will diminish and the old-age and disability pensioner cohorts will grow by incorporating the persons who have left the non-pensioner cohort. Upon reaching 60, all members of the non-pensioner cohort will begin to draw an old-age pension, leaving the non-pensioner cohort empty.
The transfer of individuals from one cohort to another can be described through the multiple states model. Below, we present a four-state model, on which the basic calculation formulae of the model are based. The less significant states, such as social and loss-of-breadwinner pensioners, are factored into the RF pension system model under a simplified scheme.
The model uses the following assumptions/premises:
1. Leaving non-pensioner state, one can go over to disability pensioner, old-age pensioner, and death states.
2. The state of death is absorbing.
3. The only state possible upon leaving the old-age and disability pensioner states is death.
4. There are no transitions determined by migration (emigration and immigration) because the State Statistical Committee of the Russian Federation (RF Goskomstat) forecasts envisage a low migration level (see Chapter 5). If need be, this model, as well as the formulae presented below, can be easily adjusted so as to directly factor in migration.
5. The probability of transition from disability pensioner to non-pensioner state is zero. The model does not provide for a person ceasing to be disabled.
6. On reaching an age entitling a person to labor old-age pension, all the persons thus entitled begin to draw an old-age pension. This is, in fact, equivalent to the assumption that individuals do not, as a rule, use the right to postpone the date when they begin to draw an old-age pension so as to draw a higher pension later.
In actual fact, this assumption has more to do with scenarios than with the modeling program itself.
7. There is no transition from disability to old-age pensioner state. Under current legislation, such transition is pointless.
Determining the size of notional pension capital (notional accumulations)
The input data for further modeling is the average starting notional pension capital (NPC) determined as of January 1, 2002, and the size of the NDC part of labor pension calculated for pensioners as of the same date[1]..
The starting size of total notionalpension capital for the non-pensioner cohort (NPCx) equals the average starting value of NPC multiplied by the size of the cohort as of January 1, 2002.
Above, we said that in 2002, the cohort of non-pensioners who were x years old in 2002 will undergo the following events:
1. The cohort will lose some of its members as:
· some persons will die in 2002;
· some of its members will go over to the cohort of persons drawing an (early) old-age pension;
· some members of the cohort will go over to the cohort of disability pensioners.
2. NPC will be subjected to indexation.
3. The annual contributions for the NDC part of the pension will be paid.
The size of summary calculation capital at age х+1 is determined using the recurrent formula:
NPCх+1= (NPCх (1+Index) + ContNPх)(1- qх - ShOAPх - ShDPх), (1)
where:
NPCх is total notional capital of the cohort at age x in the relevant forecasting year;
qх is the annual probability of death at age х in the relevant forecasting year;
Index is indexation of NDC pension and NPC in the relevant forecasting year;
ContNPх are total contributions of the non-pensioner cohort at age x in the relevant forecasting year;
ShOAP is the share of NPC of the persons who became old-age (possibly early) pensioners at age x in the relevant forecasting year; and
ShDPх is the share of NPC of the persons who were disabled at age x in the relevant forecasting year.
The meaning of formula (1) is very simple:
· expression (NPCх(1+Index) + ContNPх) equals the size of total notional pension capital one year later;
· the second factor of the right-hand side (1 - qх - ShOAPх - ShDPх) removes the shares of those who die or go over to the cohorts of disability and old-age pensioners.
Note. Strictly speaking, this formula implies that all the transitions from the non-pensioner to the other states take place at the end of the year. This assumption is used in actuarial calculations often enough for the sake of simplicity.
The share of the NPC of the persons who became disability pensioners at age x, ShDPх, is, in the general case, determined by two indicators:
а) the ratio of the share of persons who became disability pensioners at age x (in the given forecasting year) to the share of non-pensioners. Hereafter, for the sake of brevity, we shall refer to it as the share of new disability pensioners; and
б) the ratio of the NPC of these persons to the average NPC value for the cohort.
In this paper, we assume that the NPC of new disability pensioners is equal to the average NPC value for the cohort, so that only the first indicator is significant. In algorithmic terms, this assumption is easy to cancel; however, statistics (or substantiated assumptions) would be required.
The share of new disability pensioners in the total size of an age and gender group is calculated under the formula:
PcNDPх+1 = PcDPх+1 – PcDPх (1-  ), (2)
where:
PcDP is the percentage (share) of disability pensioners aged x in the total number of the age and gender group; and
is the over and above “normal” annual probability of death at age x.
To obtain the share of NPC of the new disability pensioners, ShDPх, we need to divide PcNDPх+1 by the share of non-pensioners in age and gender group х.
Formula (2) takes account of the fact that the mortality rate of the disabled is higher than among the population generally, with being the difference between the mortality rate among the disabled and the mortality rate among the population generally.
An important merit of formula (2) is that its application requires only the percentage shares of disability pensioners in each age and gender group and the excess of disability pensioner mortality over average mortality in the age and gender group generally.
The share of the NPC of the persons who became old-age (possibly early) pensioners at age x, ShOAPх,, is, in the general case, determined by two indicators:
а) the ratio of the share of persons who became old-age pensioners at age x (in the given forecasting year) to the share of non-pensioners. Below, for the sake of brevity, we shall refer to this group as the share of new old-age pensioners; and
б) the ratio of the NPC of these persons to the average NPC value for the cohort.
As in the case of new disability pensioners, this paper assumes that the NPC of the new old-age pensioners is equal to the average NPC value for the cohort, so that only the first indicator is significant.
The share of new old-age pensioners in the overall size of an age and gender group is determined under the formula:
PcNOAPх+1 = PcOAPх+1 – PcOAPх , (3)
where PcOAPх is the percentage of old-age pensioners aged x in the overall number of the given age and gender group.
Having compared formulae (3) and (2), it becomes obvious that formula (3) is based on the assumption that the mortality of old-age pensioners is the same as in the age and gender group as a whole.
To obtain the share of NPC of new old-age pensioners, ShOAPх, it remains to divide PcNOAPх+1 by the share of non-pensioners in age and gender group х.
The non-pensioners’ total contributions in year х, ContNPх, comprise the contributions of non-pensioners only. The contributions of old-age or disability pensioners are factored in when recalculating average pension size (see below).
Calculating the size of old-age pension
In the general case, people begin to draw an old-age pension at different ages. This is why the subgroups of old-age pensioners aged x+1 include both persons who already were old-age pensioners at age x and new old-age pensioners.
The pension of the new old-age pensioners is equal to their notional capital divided by the expected period of the payment of old-age labor pension T. Total notional pension capital of the new old-age pensioners is:
(NPCх (1+Index) + ContNPх) ShOAPх. (4)
The number of new old-age pensioners is:
Nх+1 PcNOAPх+1, (5)
where Nх+1 is the size of the age and gender group at age х+1 years.
Thus the NDC pension of the new pensioners, NDCOAP’х+1, is:
 . (6)
The pension of those who were already pensioners at age x will be indexed and will be
NDCOAP*х+1 = NDCOAPх(1+Index), (7)
where NDCOAPх is the NDC pension of old-age pensioners at age x.
The average NDC pension of all old-age pensioners at age х+1 is equal to the average weighted value of the pension of those who was already a pensioner at age x and the pension of the new pensioners, as well as the growth of pension at the expense of the contributions made by the employed old-age pensioners.

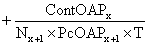 , (8)
where ContOAPх are the contributions made by the old-age pensioners aged х.
Note. As was mentioned above, the formulae for calculating the NDC part of the disability pension and the funded part of the old-age and disability pension are similar to formulae (1) – (8).
